The map below indicates U.S. Crude Death Rates by State, 2013-2017, last five year span.
Eastern states tend to have higher death rates than the U.S. crude DR 840.6 indicated by o
The map below indicates U.S. Crude Death Rates by State, 2013-2017, last five year span.
Western states tend to have lower death rates than eastern states
Eastern states tend to have higher death rates than the U.S. crude DR 840.6 indicated by o
Eastern states tend to have higher death rates than the U.S. crude DR 840.6 indicated by o
o = red circle indicates state crude death rate is greater than U.S. crude DR 840.6
Crude DR (Death Rate) = (crude deaths/population) x 100,000
U.S. crude DR 2013-2017 = ((13,493,792) / (1,605,251,406)) * 100,000 = 840.6
2013-2017, 30 states had a state crude death rate greater than the U.S. DR 840.6

How much did crude deaths increase in the in the U.S. in the last 5 year span 2013-2017 compared to the prior 5 years?
The U.S. (United States) had a 8.5% crude death increase in the last five year span, 2013-2017 versus the five years prior 2008-2012 - - 1,057,473 more deaths 2013-2017 vs 2008-2012 = 13,493,792 - 12,436,319 = 1,057,473 - 51 States had crude death increase.
Crude death is a measure of all death for a specified period and age group.
Crude death is a measure of all death for a specified period and age group.
Answer: the U.S. (United States) had a 8.5% crude death increase in the last five year span, 2013-2017 versus the five years prior 2008-2012
In the 5 year span, 2013-2017, 13,493,792 people died from a crude death, 64% of the deaths (8,677,574 deaths) occurred in 15 states: (California, Florida, Texas, New York, Pennsylvania, Ohio, Illinois, Michigan, North Carolina, Georgia, New Jersey, Tennessee, Virginia, Indiana and Missouri).

U.S. had significant 8.5% crude death increase - - - - 1,057,473 more crude deaths in the last 5 year span 2013-2017 vs 2008-2012 = 13,493,792 - 12,436,319 = 1,057,473. The United States had 13,493,792 crude deaths in the last 5 years, 2013-2017.
U.S. crude death rate increased significantly 35.7 points comparing recent 5 year crude death rate to prior 5, 2013-2017 vs 2008-2012 death rates = 840.6 - 804.9 = 35.7 crude death rate point increase in the last 5 year period."
DR (Death Rate) = (Crude Death Rate)/Population*100,000.
U.S. Crude DR during 2013-2017 = (Deaths/Population)*100,000 = 840.6 = ((13,493,792) / (1,605,251,406)) * 100,000 = 840.6
Calculation for Percent Change = ((New Value - Old Value)/ Old Value )*100 = 8.5% = U.S. ((2013-2017 Crude deaths - 2008-2012 Crude deaths) /(2008-2012 Crude deaths))*100 = ((13,493,792 - 12,436,319)/(12,436,319))*100 = (1,057,473/12,436,319)*100 = 8.5% crude death increase in the last five year span, 2013-2017 versus the five years prior 2008-2012 .
- 3.1% of crude deaths are between ages 15-34 years old, (414,359 age 15-34 year old crude deaths, in the 5 year span, 2013-2017)
- 13.5% of crude deaths are between ages 0-54 years old, (1,819,866 of crude deaths are between ages 0-54 years old,, in the 5 year span, 2013-2017)

U.S. lost young persons age 15-34 years old to a crude death at the rate of 227 crude deaths per day during 2013-2017 = 414,359 crude deaths / 5 years = 82871.8 deaths per year / 365 days per year = 227 crude deaths per day during years 2013-2017.
U.S. lost residents to a crude death at the rate of 7394 crude deaths per day during 2013-2017 = 13,493,792 crude deaths / 5 years = 2698758.4 deaths per year / 365 days per year = 7394 crude deaths per day during years 2013-2017.

Which age group had the biggest increase in crude deaths in the U.S. in the last 5 year span 2013-2017 compared to the prior 5 years?
Answer: The ten-year age group ages 25-34 years old had a 21.6% increase in crude deaths, the largest increase in crude death in the last five year span, 2013-2017 versus the five years prior 2008-2012.

U.S. young people ages 25-34 years old had a 21.6% crude death increase - - - - 46,613 more ages 25-34 years old crude deaths in the last 5 year Span vs prior 5 years, 2013-2017 vs 2008-2012 = 261,988 - 215,375 = 46,613 more crude deaths in the last 5 Year Span. U.S. young people ages 25-34 years old had 261,988 crude deaths in the last 5 years, 2013-2017.
U.S young people ages 25-34 years crude death rate increased significantly 14.3 points comparing recent 5 year crude death rate to prior 5, 2013-2017 vs 2008-2012 death rates = 118.8 - 104.5 = 14.3 death rate point increase in the last 5 year period!!!
Note: It is out of character for this age group, age 25-34 years old, to have significant death increase. It is not normal for a young healthy age group to have a significant death increase. To understand this significance, the next set up published reports will look at the prior five year crude deaths for comparison.
Additionally, to understand the impact increased potency mind-altering substances are having on peoople - we will look at mind-altering substance deaths for this population in the same period and a look at prior five year mind-altering substance deaths 2008-2012 vs 2003-2007.
Calculation for Percent Change (%Death increase/decrease) = ((New Value - Old Value)/ Old Value )*100 = 21.6% = 25-34 years ((2013-2017 Crude deaths - 2008-2012 Crude deaths ) / (2008-2012 Crude deaths ))*100 = ((261,988 - 215,375) / ( 215,375))*100 = ((46,613) / ( 215,375))*100 = 21.6% crude death increase for ages 25-34 years old.
What three states have the highest crude death rates 2013-2017? States with the highest death rates need the most support.
Answer: West Virginia, Alabama and Main have the highest crude death rates 2013-2017.

During 2013-2017, five year span, 30 states had a crude death rate greater than or equal to the U.S. death rate '840.6', listed worst to best: West Virginia, Alabama, Maine, Arkansas, Mississippi, Kentucky, Pennsylvania, Ohio, Tennessee, Oklahoma, Missouri, South Carolina, Michigan, Louisiana, Montana, Iowa, Indiana, Florida, Rhode Island, Vermont, Delaware, Kansas, South Dakota, Wisconsin, New Hampshire, North Carolina, Oregon, Nebraska, New Mexico, Connecticut, North Dakota.
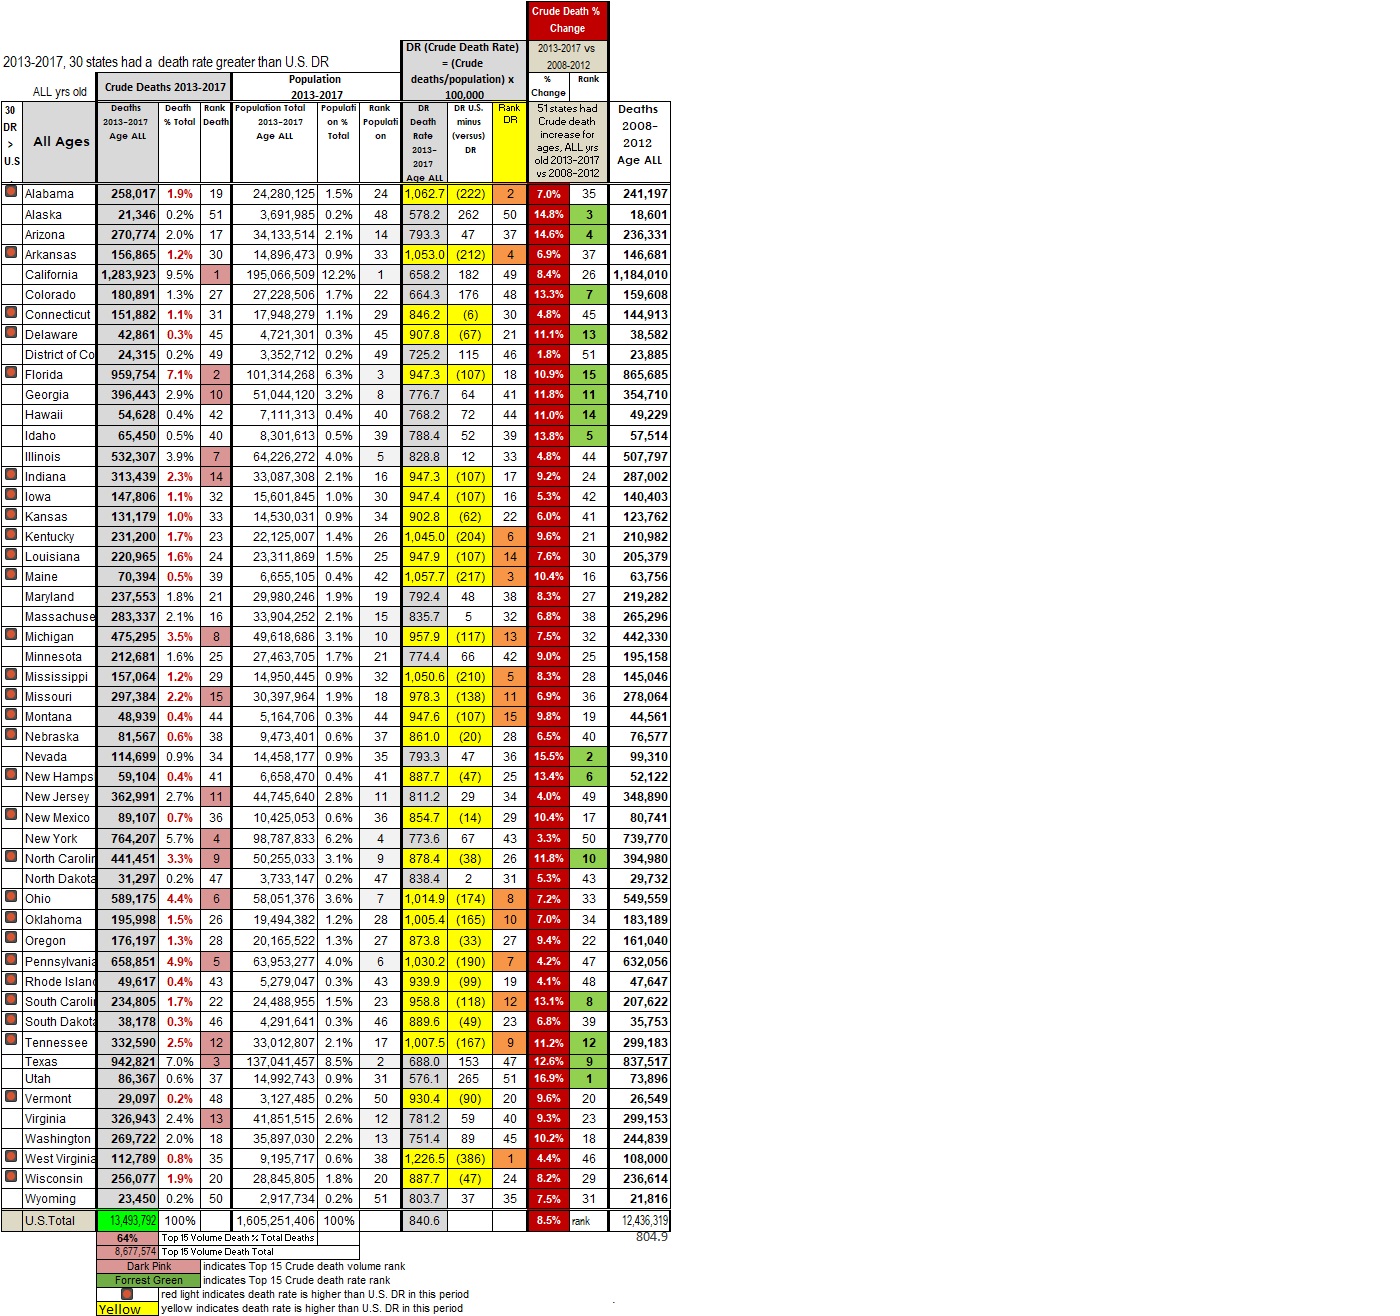
The table below indicates the 13,493,792 U.S. crude deaths, 2013-2017, 5 year span, sorted by state crude death rate.
Orange indicates the top 15 worst Crude death rates per state population. The red bars to the right indicate crude death volume.
DR (Death Rate) = (Crude Death Rate)/Population*100,000.
U.S. Crude DR during 2013-2017 = (Deaths/Population)*100,000 = 840.6 = ((13,493,792) / (1,605,251,406)) * 100,000 = 840.6
There were 840.6 Crude deaths per 100,000 persons in the U.S. during 2013-2017.
 the Red light indicates a state crude DR is higher "worse" than the U.S. crude DR '840.6'. States that are struggling with crude deaths have a higher DR than the U.S. DR.
Population rank is broken into three categories:
HV = high volume 1-15 = HV
MV = medium volume 16-31 = MV
LV = low volume = 32+ = LV

The chart below sorts U.S. crude Deaths 2013-2017, 5 year span by state crude death volume.

What state had the highest crude death increase in the last five year span, 2013-2017, compared to the five years prior 2008-2012?
Answer: Utah had a 16.9% crude death increase, the highest crude death increase 2013-2017.
Utah had a 16.9% crude death increase - - - - 12,471 more crude deaths in the last 5 year span vs prior 5 years, 2013-2017 vs 2008-2012 = 86,367 - 73,896 = 12,471 more crude deaths in the last 5 year span. Utah had 86,367 crude deaths in the last 5 years, 2013-2017.
Utah crude death rate increased significantly, 41.5 points, comparing recent the five year crude death rate to the prior five years, 2013-2017 versus 2008-2012 death rates = 576.1 - 534.6 = 41.5 death rate point increase in the last 5 year period.
Calculation for Percent Change (crude death increase) = ((New Value - Old Value)/ Old Value )*100 = 16.9% = Utah ((2013-2017 Crude deaths - 2008-2012 Crude deaths ) / (2008-2012 Crude deaths ))*100 = ((86,367 - 73,896) / ( 73,896))*100 = ((12,471) / ( 73,896))*100 = 16.9%

The table below indicates the 13,493,792 crude U.S. deaths, 2013-2017, 5 year span compared to 5 years prior 2008-2012, sorted by state crude death percent change (crude death increase/decrease). Calculation for Percent Change = ((New Value - Old Value)/ Old Value )*100 = ((2013-2017 crude deaths - 2008-2012 crude deaths ) / (2008-2012 crude deaths ))*100
Dark Red Highlight indicates state death increase in the table below. States that have high death increase, need critical support to investigate counties where this is happening, to understand what is causing this high death increase to develop strategies to support good health and prevent early death. (County reports will be out ASAP)

The map below indicates U.S. Crude Death Rates by State, 2013-2017, last five year span.
Western states tend to have lower death rates than eastern states
Eastern states tend to have higher death rates than the U.S. crude DR 840.6 indicated by o
Eastern states tend to have higher death rates than the U.S. crude DR 840.6 indicated by o
o = red circle indicates state crude death rate is greater than U.S. crude DR 840.6
Crude DR (Death Rate) = (crude deaths/population) x 100,000
U.S. crude DR 2013-2017 = ((13,493,792) / (1,605,251,406)) * 100,000 = 840.6
2013-2017, 30 states had a state crude death rate greater than the U.S. DR 840.6


Colorado had significant a 13.3% crude death increase - - - - 21,283 more crude deaths in the last 5 year span vs prior 5 years, 2013-2017 vs 2008-2012 = 180,891 - 159,608 = 21,283 more crude deaths in the last 5 year span. Colorado had 180,891 crude deaths in the last 5 years, 2013-2017.
Colorado crude death rate increased significantly 30.9 points comparing recent 5 year crude death rate to prior 5, 2013-2017 vs 2008-2012 death rates = 664.3 - 633.5 = 30.9 death rate point increase in the last 5 yr period.
Calculation for Percent Change = ((New Value - Old Value)/ Old Value )*100 = 13.3% =
Colorado ((2013-2017 Crude deaths - 2008-2012 Crude deaths ) / (2008-2012 Crude deaths ))*100 = ((180,891 - 159,608) / ( 159,608))*100 = ((21,283) / ( 159,608))*100 = 13.3%

Michigan had significant a 7.5% crude death increase - - - - 32,965 more crude deaths in the last 5 year span vs prior 5 years, 2013-2017 vs 2008-2012 = 475,295 - 442,330 = 32,965 more crude deaths in the last 5 year span. Michigan had 475,295 crude deaths in the last 5 years, 2013-2017.
Michigan crude death rate increased significantly 64.1 points comparing recent 5 year crude death rate to prior 5, 2013-2017 vs 2008-2012 death rates = 957.9 - 893.7 = 64.1 death rate point increase in the last 5 yr period.
Calculation for Percent Change = ((New Value - Old Value)/ Old Value )*100 = 7.5% =
Michigan ((2013-2017 Crude deaths - 2008-2012 Crude deaths ) / (2008-2012 Crude deaths ))*100 = ((475,295 - 442,330) / ( 442,330))*100 = ((32,965) / ( 442,330))*100 = 7.5%

Ohio had significant a 7.2% crude death increase - - - - 39,616 more crude deaths in the last 5 year span vs prior 5 years, 2013-2017 vs 2008-2012 = 589,175 - 549,559 = 39,616 more crude deaths in the last 5 year span. Ohio had 589,175 crude deaths in the last 5 years, 2013-2017.
Ohio crude death rate increased significantly 62. points comparing recent 5 year crude death rate to prior 5, 2013-2017 vs 2008-2012 death rates = 1014.9 - 952.9 = 62. death rate point increase in the last 5 yr period."
Calculation for Percent Change = ((New Value - Old Value)/ Old Value )*100 = 7.2% =
Ohio ((2013-2017 Crude deaths - 2008-2012 Crude deaths ) / (2008-2012 Crude deaths ))*100 = ((589,175 - 549,559) / ( 549,559))*100 = ((39,616) / ( 549,559))*100 = 7.2%"
*******************************************************************
This report includes all deaths, Crude death is a measure of all death for a specified period and age group.
This report includes all deaths, Crude death is a measure of all death for a specified period and age group.
*******************************************************************
Source:
Centers for Disease Control and Prevention, National Center for Health Statistics. Dataset: Underlying Cause of Death. 1999-2017 on CDC WONDER Online Database, released December, 2018. Data from the Multiple Cause of Death Files, 1999-2017, as compiled from data provided by the 57 vital statistics jurisdictions through the Vital Statistics Cooperative Program. CDC source data, but not a CDC publication. Data Accessed at http://wonder.cdc.gov/ and https://wonder.cdc.gov/ucd-icd10.html
Group By: State; Ten-Year Age Groups
Copyright information
Permission is given to print and share this report to support education and health of people, free of charge. When you share or print, suggested citation includes source, facebook page and blog.
Resources –Seeking Help
Medical Emergency Call 911
National Suicide Prevention Lifeline http://www.suicidepreventionlifeline.org
National Suicide Prevention Lifeline 1-800-273-TALK
National Suicide Prevention Lifeline 1-800-273-8255
National Suicide Prevention Lifeline for Deaf & hard of hearing 1-800-799-4889
If You Suspect your child is using drugs http://www.drugfree.org/intervene
Treatment Locator – National listing by SAMHSA and Referral Hotline (SAMHSA) 1-877-SAMHSA-7a
Veteran’s and their Families. http://www.veteranscrisisline.net/Resources/SpreadTheWord.aspx
Veteran’s and their Families Call: 1-800-273-8255
How Much is Too Much? https://www.rethinkingdrinking.niaaa.nih.gov/How-much-is-too-much/Whats-the-harm/What-Are-The-Risks.aspx
24 Hour Toll Free Prayer Lines
Daystar 1-800-329-0029
Catholic prayer hotline TBD
National Prayer Center Assemblies of God 1-800-477-2937
Christian Broadcasting Network (700 Club) 1-800-759-0700
Common Ground: (248) 456-8144
Responsibility:
Young people are a blessing and are made to live. Losing young people in the land in which we live is devastating, we must never forget those we lost and keep moving forward to prevent the next generation from stumbling into this situation.
When young deaths rise, a critical situation is occurring, as responsible citizens, we can find ways to support critical populations, support the young, elderly and the lowly. We can investigate what is happening, have any laws changed in an area that could affect the health of people.
Greatest Commandment: Matthew 22:35-40
35 Then one of them, which was a lawyer, asked him a question, tempting him, and saying, 36 Master, which is the great commandment in the law? 37 Jesus said unto him, Thou shalt love the Lord thy God with all thy heart, and with all thy soul, and with all thy mind. 38 This is the first and great commandment. 39 And the second is like unto it, Thou shalt love thy neighbor as thyself. 40 On these two commandments hang all the law and the prophets.
Contact:
If you would like to join us in supporting good health of all people call 248-392-8676 or email hismatter@gmail.com or join us at
Understanding death increase enables residents to understand critical populations to work on solutions and give support. Living in Grace created these reports to improve the health and well-being of persons living in the United States.
Living in Grace Page https://www.facebook.com/livinginGracematters/