How much did mind-altering substance deaths increase in the in the U.S. in the last 5 year span 2013-2017 compared to the prior 5 year span 2008-2012?
The U.S. (United States) had significant 35.5% mind-altering-substance-death increase in the last five year span, 2013-2017 vs 2008-2012 - - 123,368 more substance deaths in the last five year span 2013-2017 vs 2008-2012 = 471,222 - 347,854 = 123,368. 51 States had substance death increase.
Answer: the U.S. (United States) had a 35.5% mind-altering substance death increase, 2013-2017 vs 2008-2012
In the last 5 year span, 2013-2017, 471,222 people died from a mind-altering Substance death in the U.S. (see Substance Death ICD List below) - 64% of the deaths (300,692 deaths) occurred in 15 states: (California, Florida, Texas, Ohio, Pennsylvania, New York, Michigan, Illinois, North Carolina, Arizona, Massachusetts, New Jersey, Washington, Tennessee and Georgia).

The U.S. had significant 35.5% substance death increase - - - 123,368 more substance deaths in the last five year span, 2013-2017 vs 2008-2012 = 471,222 - 347,854 = 123,368. The United States had 471,222 substance deaths in the last 5 years, 2013-2017.
U.S. substance death rate increased significantly 6.8 points comparing recent 5 year substance death rate to prior 5, 2013-2017 vs 2008-2012 death rates = 29.4 - 22.5 = 6.8 substance death rate point increase in the last 5 year period.
U.S. substance death rate increased significantly 6.8 points comparing recent 5 year substance death rate to prior 5, 2013-2017 vs 2008-2012 death rates = 29.4 - 22.5 = 6.8 substance death rate point increase in the last 5 year period.
Calculation for Percent Change = ((New Value - Old Value)/ Old Value )*100 = 35.5% = U.S. ((2013-2017 Substance deaths - 2008-2012 Substance deaths ) / (2008-2012 Substance deaths ))*100 = ((471,222 - 347,854)/(347,854))*100 = (123,368/347,854)*100 = 35.5%
When a person is
suffering from a addiction “unrecovered" (without protected recovery and
support), a person sometimes reach for another mind-altering substance to deal
with hard withdraw, as such, addiction increases.
Mind-altering substances have
increased in variety and poisonous strength. To understand the impact
increased mind-altering substance potency is having on U.S. families, this
report includes all mind-altering substance deaths, not just opiates. This
report includes opiates, narcotics, marijuana/cannabinoids, vaping, alcohol,
methamphetamine, sedatives, benzodiazepines, tranquilizers, xanax, stimulants,
cocaine, hallucinogens, tobacco and other mind-altering substances, see Substance Death ICD List below.
U.S., Substance Deaths 2013-2017 = 471,222, 5 Year Span
- 21.3% of Substance deaths are between ages 15-34 years old, (100,498 age 15-34 yr old substance deaths, in the 5 year span, 2013-2017)
- 64.9% of Substance deaths are between ages 0-54 years old, (305,826 of substance deaths are are under age 54 years old, in the 5 year span, 2013-2017)

U.S. lost young persons ages 15-34 years old to a substance death at the rate of 55 substance deaths per day during 2013-2017 = 100,498 substance deaths / 5 years = 20,099.6 deaths per year / 365 days per year = 55 substance deaths per day during years 2013-2017.
U.S. lost residents to a substance death at the rate of 258 substance deaths per day during 2013-2017 = 471,222 substance deaths / 5 years = 94,244.4 deaths per year / 365 days per
year = 258 substance deaths per day during years 2013-2017.

Which age group had the largest increase in substance deaths in the last 5 year span 2013-2017 compared to the prior 5 years?
Answer: Ages 25-34 years old, had significant 64.7% increase in substance deaths, the largest increase in substance death per age group, in the last five year span, 2013-2017 versus the five years prior 2008-2012.
Note: This is out of character for this age group, it is not normal for a young healthy age group to have a significant death increase. To understand this significance, we can look at the prior five years to compare. Soon to follow is a look at crude deaths in the same period and a look at the prior five year substance deaths 2008-2012 vs 2003-2007.
U.S. young adults ages 25-34 years old had significant 64.7% substance death increase - - - - 29,610 more substance deaths in the last 5 Year Span vs prior 5 years, 2013-2017 vs 2008-2012 = 75,350 - 45,740 = 29,610 more substance deaths in the last 5 Year Span. U.S. young adults ages 25-34 years old had 75,350 mind-altering substance deaths in the last 5 years, 2013-2017.
U.S young adults ages 25-34 years substance death rate increased significantly 12. points comparing recent 5 year substance death rate to prior 5, 2013-2017 vs 2008-2012 death rates = 34.2 - 22.2 = 12. point substance death rate point increase in the last 5 yr period.
Calculation for Percent Change = ((New Value - Old Value)/ Old Value )*100 = 64.7% =
25-34 years ((2013-2017 Substance deaths - 2008-2012 Substance deaths ) / (2008-2012 Substance deaths ))*100 = ((75,350 - 45,740) / ( 45,740))*100 = ((29,610) / ( 45,740))*100 = 64.7%

What three states have the highest substance death rates 2013-2017? States with the highest death rates need the most support.
Answer: West Virginia, New Mexico and New Hampshire have the highest substance death rates 2013-2017.

During 2013-2017, five year span, 30 states had a substance death rate greater than or equal to the U.S. '29.4', listed worst to best: West Virginia, New Mexico, New Hampshire, Ohio, Rhode Island, Kentucky, Alaska, Wyoming, Arizona, District of Columbia, Nevada, Pennsylvania, Oregon, Maine, Massachusetts, Oklahoma, Delaware, Tennessee, Michigan, Vermont, Montana, Colorado, Connecticut, Indiana, Washington, Maryland, Florida, Utah, Wisconsin, Missouri.
 the Red light indicates a state substance DR is higher "worse" than the U.S. substance DR '29.4'. States that are struggling with substance deaths have a higher DR than the U.S. DR.
The chart below sorts U.S. Substance Deaths 2013-2017, 5 year span by state substance death volume.

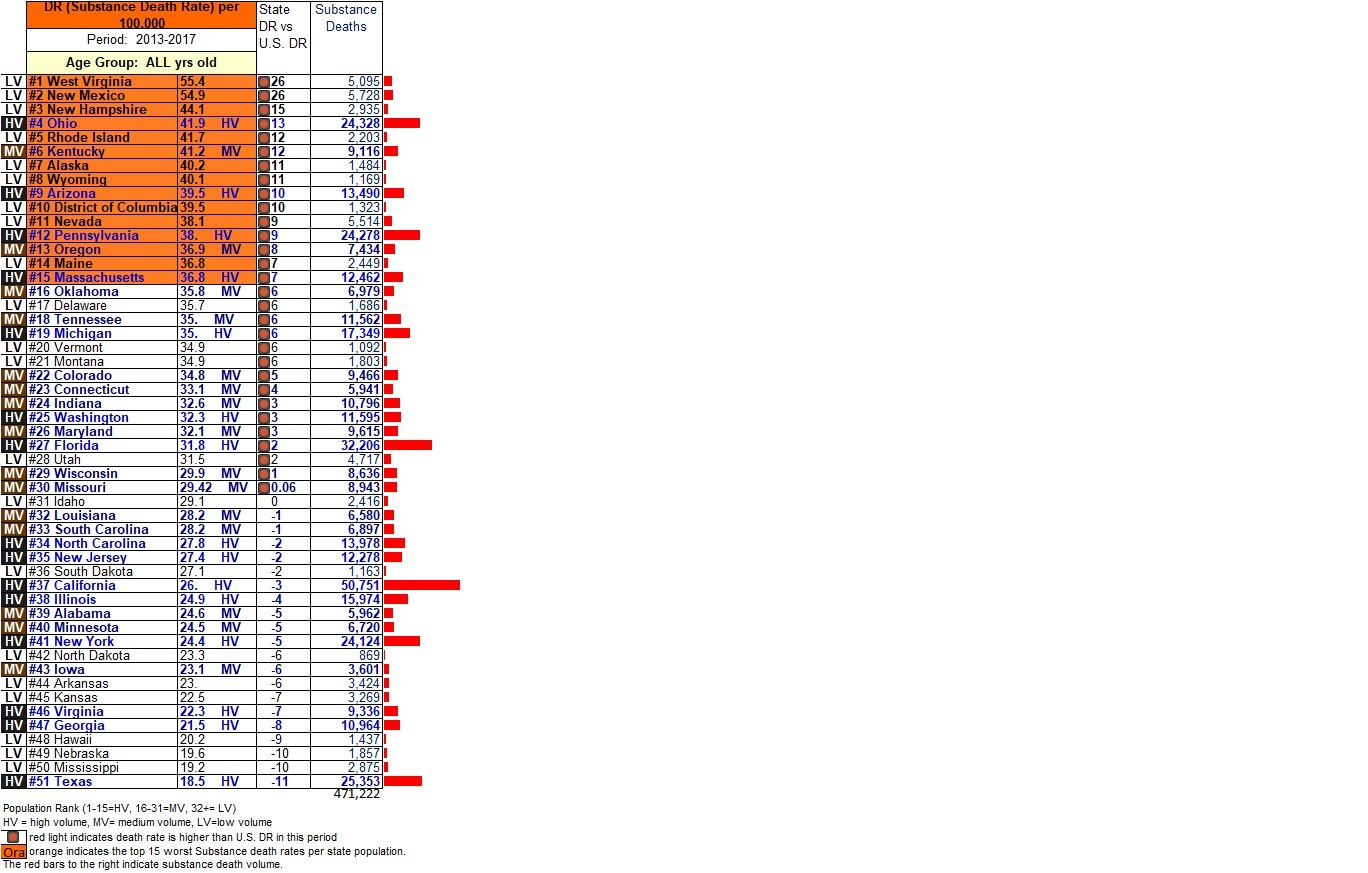
The table below indicates the 471,222 U.S. Substance deaths, 2013-2017, 5 year span, sorted by state substance death rate.
Orange indicates the top 15 worst Substance death rates per state population. The red bars to the right indicate substance death volume.
DR (Death Rate) = (Substance Death Rate)/Population*100,000. U.S. Substance DR during 2013-2017 = (Deaths/Population)*100,000 = ((471,222) / (1,605,251,406)) * 100,000= 29.4. There were 29.4 Substance deaths per 100,000 persons in the U.S. during 2013-2017.
the Red light indicates a state substance DR is higher "worse" than the U.S. substance DR '29.4'. States that are struggling with substance deaths have a higher DR than the U.S. DR.
Population rank is broken into three categories:
HV = high volume 1-15 = HV
MV = medium volume 16-31 = MV
LV = low volume = 32+ = LV
What state had the highest substance death increase in the last five year span, 2013-2017, compared to the five years prior 2008-2012?
Answer: Connecticut had a 85.1% substance death increase, the highest state substance death increase 2013-2017. Connecticut had significant a 85.1% substance death increase - - - - 2,731 more substance deaths in the last 5 year span vs prior 5 years, 2013-2017 vs 2008-2012 = 5,941 - 3,210 = 2,731 more substance deaths in the last 5 year span.
Connecticut had 5,941 substance deaths in the last 5 years, 2013-2017. Connecticut substance death rate increased significantly 15.1 points comparing recent 5 year substance death rate to prior 5, 2013-2017 vs 2008-2012 death rates = 33.1 - 18. = 15.1 death rate point increase in the last 5 year period.
Calculation for Percent Change (substance death increase) = ((New Value - Old Value)/ Old Value )*100 = 85.1% = Connecticut ((2013-2017 substance deaths - 2008-2012 substance deaths ) / (2008-2012 substance deaths ))*100 = ((5,941 - 3,210) / ( 3,210))*100 = ((2,731) / ( 3,210))*100 = 85.1%
Calculation for Percent Change (substance death increase) = ((New Value - Old Value)/ Old Value )*100 = 85.1% = Connecticut ((2013-2017 substance deaths - 2008-2012 substance deaths ) / (2008-2012 substance deaths ))*100 = ((5,941 - 3,210) / ( 3,210))*100 = ((2,731) / ( 3,210))*100 = 85.1%
The table below indicates the 471,222 Substance U.S. deaths, 2013-2017, 5 year span compared to 5 years prior 2008-2012, sorted by state substance death percent change (substance death increase/decrease). Calculation for Percent Change = ((New Value - Old Value)/ Old Value )*100 = ((2013-2017 Substance deaths - 2008-2012 Substance deaths ) / (2008-2012 Substance deaths ))*100
Dark Red Highlight indicates state death increase in the table below. States that have high death increase, need critical support to investigate counties where this is happening, to understand what is causing this high death increase to develop strategies to support good health and prevent early death. (County reports will be out ASAP)


Michigan had significant a 31.4% substance death increase - - - - 4,145 more substance deaths in the last 5 year span vs prior 5 years, 2013-2017 vs 2008-2012 = 17,349 - 13,204 = 4,145 more substance deaths in the last 5 year span. Michigan had 17,349 substance deaths in the last 5 years, 2013-2017.
Michigan substance death rate increased significantly 8.3 points comparing recent 5 year substance death rate to prior 5, 2013-2017 vs 2008-2012 death rates = 35. - 26.7 = 8.3 death rate point increase in the last 5 yr period."
Calculation for Percent Change = ((New Value - Old Value)/ Old Value )*100 = 31.4% = Michigan ((2013-2017 Substance deaths - 2008-2012 Substance deaths ) / (2008-2012 Substance deaths ))*100 = ((17,349 - 13,204) / ( 13,204))*100 = ((4,145) / ( 13,204))*100 = 31.4%

Colorado had significant a 20.5% substance death increase - - - - 1,613 more substance deaths in the last 5 year span vs prior 5 years, 2013-2017 vs 2008-2012 = 9,466 - 7,853 = 1,613 more substance deaths in the last 5 year span. Colorado had 9,466 substance deaths in the last 5 years, 2013-2017.
Colorado substance death rate increased 3.6 points comparing recent 5 year substance death rate to prior 5, 2013-2017 vs 2008-2012 death rates = 34.8 - 31.2 = 3.6 death rate point increase in the last 5 yr period.
Calculation for Percent Change = ((New Value - Old Value)/ Old Value )*100 = 20.5% = Colorado ((2013-2017 Substance deaths - 2008-2012 Substance deaths ) / (2008-2012 Substance deaths ))*100 = ((9,466 - 7,853) / ( 7,853))*100 = ((1,613) / ( 7,853))*100 = 20.5%

Ohio had significant a 72.4% substance death increase - - - - 10,217 more substance deaths in the last 5 year span vs prior 5 years, 2013-2017 vs 2008-2012 = 24,328 - 14,111 = 10,217 more substance deaths in the last 5 year span. Ohio had 24,328 substance deaths in the last 5 years, 2013-2017.
Ohio substance death rate increased significantly 17.4 points comparing recent 5 year substance death rate to prior 5, 2013-2017 vs 2008-2012 death rates = 41.9 - 24.5 = 17.4 death rate point increase in the last 5 yr period.
Calculation for Percent Change = ((New Value - Old Value)/ Old Value )*100 = 72.4% = Ohio ((2013-2017 Substance deaths - 2008-2012 Substance deaths ) / (2008-2012 Substance deaths ))*100 = ((24,328 - 14,111) / ( 14,111))*100 = (10,217) / ( 14,111))*100 = 72.4%!!!!

Arizona had a 31.4% substance death increase - - - - 3,221 more substance deaths in the last 5 year span vs prior 5 years, 2013-2017 vs 2008-2012 = 13,490 - 10,269 = 3,221 more substance deaths in the last 5 year span. Arizona had 13,490 substance deaths in the last 5 years, 2013-2017.
Arizona substance death rate increased 7.5 points comparing recent 5 year substance death rate to prior 5, 2013-2017 vs 2008-2012 death rates = 39.5 - 32. = 7.5 death rate point increase in the last 5 yr period.
Calculation for Percent Change = ((New Value - Old Value)/ Old Value )*100 = 31.4% = Arizona ((2013-2017 Substance deaths - 2008-2012 Substance deaths ) / (2008-2012 Substance deaths ))*100 = ((13,490 - 10,269) / ( 10,269))*100 = ((3,221) / ( 10,269))*100 = 31.4%

Washington had a 18.68% substance death increase - - - - 1,825 more substance deaths in the last 5 year span vs prior 5 years, 2013-2017 vs 2008-2012 = 11,595 - 9,770 = 1,825 more substance deaths in the last 5 year span. Washington had 11,595 substance deaths in the last 5 years, 2013-2017.
Washington substance death rate increased 3.3 points comparing recent 5 year substance death rate to prior 5, 2013-2017 vs 2008-2012 death rates = 32.3 - 29. = 3.3 death rate point increase in the last 5 yr period.
Calculation for Percent Change = ((New Value - Old Value)/ Old Value )*100 = 18.7% = Washington ((2013-2017 Substance deaths - 2008-2012 Substance deaths ) / (2008-2012 Substance deaths ))*100 = ((11,595 - 9,770) / ( 9,770))*100 = ((1,825) / ( 9,770))*100 = 18.7%

Alabama had a 27.6% substance death increase - - - - 1,290 more substance deaths in the last 5 year span vs prior 5 years, 2013-2017 vs 2008-2012 = 5,962 - 4,672 = 1,290 more substance deaths in the last 5 year span. Alabama had 5,962 substance deaths in the last 5 years, 2013-2017.
Alabama substance death rate increased 5. points comparing recent 5 year substance death rate to prior 5, 2013-2017 vs 2008-2012 death rates = 24.6 - 19.6 = 5. death rate point increase in the last 5 yr period."
Calculation for Percent Change = ((New Value - Old Value)/ Old Value )*100 = 27.6% = Alabama ((2013-2017 Substance deaths - 2008-2012 Substance deaths ) / (2008-2012 Substance deaths ))*100 = ((5,962 - 4,672) / ( 4,672))*100 = ((1,290) / ( 4,672))*100 = 27.6%

Alaska had a 12.9% substance death increase - - - - 170 more substance deaths in the last 5 year span vs prior 5 years, 2013-2017 vs 2008-2012 = 1,484 - 1,314 = 170 more substance deaths in the last 5 year span. Alaska had 1,484 substance deaths in the last 5 years, 2013-2017.
Alaska substance death rate increased 3.2 points comparing recent 5 year substance death rate to prior 5, 2013-2017 vs 2008-2012 death rates = 40.2 - 37. = 3.2 death rate point increase in the last 5 yr period."
Calculation for Percent Change = ((New Value - Old Value)/ Old Value )*100 = 12.9% = Alaska ((2013-2017 Substance deaths - 2008-2012 Substance deaths ) / (2008-2012 Substance deaths ))*100 = ((1,484 - 1,314) / ( 1,314))*100 = ((170) / ( 1,314))*100 = 12.9%

Arkansas had significant a 13.8% substance death increase - - - - 415 more substance deaths in the last 5 year span vs prior 5 years, 2013-2017 vs 2008-2012 = 3,424 - 3,009 = 415 more substance deaths in the last 5 year span. Arkansas had 3,424 substance deaths in the last 5 years, 2013-2017.
Arkansas substance death rate increased 2.3 points comparing recent 5 year substance death rate to prior 5, 2013-2017 vs 2008-2012 death rates = 23. - 20.6 = 2.3 death rate point increase in the last 5 yr period.
Calculation for Percent Change = ((New Value - Old Value)/ Old Value )*100 = 13.8% = Arkansas ((2013-2017 Substance deaths - 2008-2012 Substance deaths ) / (2008-2012 Substance deaths ))*100 = ((3,424 - 3,009) / ( 3,009))*100 = ((415) / ( 3,009))*100 = 13.8%

California had significant a 15.1% substance death increase - - - - 6,657 more substance deaths in the last 5 year span vs prior 5 years, 2013-2017 vs 2008-2012 = 50,751 - 44,094 = 6,657 more substance deaths in the last 5 year span. California had 50,751 substance deaths in the last 5 years, 2013-2017.
California substance death rate increased 2.4 points comparing recent 5 year substance death rate to prior 5, 2013-2017 vs 2008-2012 death rates = 26. - 23.6 = 2.4 death rate point increase in the last 5 yr period.
Calculation for Percent Change = ((New Value - Old Value)/ Old Value )*100 = 15.1% = California ((2013-2017 Substance deaths - 2008-2012 Substance deaths ) / (2008-2012 Substance deaths ))*100 = ((50,751 - 44,094) / ( 44,094))*100 = ((6,657) / ( 44,094))*100 = 15.1%

Connecticut had significant a 85.1% substance death increase - - - - 2,731 more substance deaths in the last 5 year span vs prior 5 years, 2013-2017 vs 2008-2012 = 5,941 - 3,210 = 2,731 more substance deaths in the last 5 year span. Connecticut had 5,941 substance deaths in the last 5 years, 2013-2017.
Connecticut substance death rate increased significantly 15.1 points comparing recent 5 year substance death rate to prior 5, 2013-2017 vs 2008-2012 death rates = 33.1 - 18. = 15.1 death rate point increase in the last 5 yr period."
Calculation for Percent Change = ((New Value - Old Value)/ Old Value )*100 = 85.1% = Connecticut ((2013-2017 Substance deaths - 2008-2012 substance deaths ) / (2008-2012 substance deaths ))*100 = ((5,941 - 3,210) / ( 3,210))*100 = ((2,731) / ( 3,210))*100 = 85.1%


This report includes all mind-altering substance deaths, not just opiates. Opiates, narcotics, marijuana/cannabinoids, vaping, alcohol, meth, sedatives, benzodiazepines, tranquilizers, xanax, stimulants, cocaine, hallucinogens, tobacco and other mind-altering substances are included in this report, see Substance Death ICD List below. When a person is suffering from a physical addiction “unrecovered (without protected recovery and support), a person sometimes reaches for another mind-altering substance to deal with hard withdraw, as such, addiction increases. Substances have increased in variety and poisonous strength.
When mind altering substances increase in an area - accidents, suicides, homelessness and sicknesses increase due to the high/drunk deceiving effect a mind-altering substance has on a person.
--------------------------
Cap It
Without limits, a mind altering substance becomes an accidental abuse. Blue Cross Blue Shield of Michigan announced in 2018 it will cap, limit its members' opioid prescriptions to 30 days, and in some cases, five days in efforts to address the opioid epidemic in both its state and the nation. Limits protect health, prevent over-prescribing and help decrease addiction and accidental deaths, https://www.thefix.com/
**************************
Over-prescribing:
Over prescribing a mind-altering substance, historically does not do well for young people in the area. Limits should be placed on ALL mind altering substances to prevent them from reaching a crowd of people for which they were not intended, young people.
For example, in West Virginia between 2006 and 2016, drug distributors shipped large quantities of hydrocodone and oxycodone to two pharmacies in Williamson at the same time a doctor overprescribed. As such, West Virginia Age 15-34 year old crude death rate increased to 139.3 is 48.6 points higher than US death rate 90.7 during the same year period 2012-2016.
See link to view West Virginia article. https://www.wvgazettemail.com/news/health/drug-firms-shipped-m-pain-pills-to-wv-town-with/article_ef04190c-1763-5a0c-a77a-7da0ff06455b.html
************************************************************************************
Recreational marijuana a type of over-prescribing. Over-prescribing mind-altering substances has a history of making their way to people they were not intended, such as young people, with devastating results. Over-prescribing does not do well for young people in the area in terms of young crude deaths, young crude deaths tend to increase in areas where lax mind-altering substance laws are instituted.
(1). removes a doctor prescription so adults over 21 years old can use any time for any reason and
(2). For example, in the Michigan ballot which went through in 2018, which proposed legalizing 10 ounces of marijuana, which equates to 567 marijuana joints, an 18 month daily supply of 0.5 gram size marijuana, a year and a half supply of marijuana allowed in homes in Michigan where people are over 21 years of age – heavy over-prescribing! Mind-altering substances should have no more than a 2-4 week supply, see Cap It above. (a). 2.5 ounces (141 joints can be sitting in the house out in the open) a 4.5 month supply of marijuana can be sitting out in the open in any home a child could enter --- which is NOT safe for young people who live in the area (b). the rest of the 10 ounces, 426 joints - {calculation 567 joints -141 joints = 426 joints} the 426 joints have to be secured in locked container in a residence.
--------------------------
For example, Colorado, a recreation marijuana state, had a 27% increase in young crude deaths for ages 25-34 years old comparing the 5 year span 2012-2016 to the five years prior 2007-2011, 901 more crude deaths in the 5 year span following recreational marijuana implementation versus the prior 5 years prior, 2012-2016 vs 2007-2011 = 4,232 - 3,331 = 901 more crude deaths in the 5 year span 2012-2016. Colorado had 4,232 age 25-34 year old crude deaths in the 5 year period, 2012-2016. After recreational marijuana was implemented, Colorado age 25-34 year old crude death rate increased significantly 12.4 points comparing 2012-2016 vs 2007-2011 death rates = 105.6 - 93.2 = 12.4 death rate point increase.
--------------------------
Teens Marijuana Use:
How do we know marijuana is making its way to the hands of teens, a sad note by NIDA, December 2017, states "daily marijuana use exceeds daily cigarette use among 8th (0.8 vs. 0.6 percent), 10th (2.9 vs. 2.2 percent) and 12th (5.9 vs. 4.2 percent) graders. DAILY MARIJUANA USE is physical addiction in young people, so very sad the struggles these teens are facing due to lax laws that removed strong barriers to prevent substances from reaching young people. Daily marijuana use is
1 in 7 teens report using marijuana in the past month indicates NIDA (National Institute on Drug Abuse); National Institutes of Health; U.S. Department of Health and Human Services web site 9-28-19 , https://teens.drugabuse.gov/drug-facts/marijuana
-
Marijuana has a strong potential for abuse and is classified as a schedule Ι drug.
--------------------------
Marijuana THC Potency Increased (THC is the addictive part that gets a person high) The potency of an average marijuana cigarette has steadily increased from 3 percent THC in the early 1990's to 12.5 percent THC in 2013. NIDA (National Institute on Drug Abuse); National Institutes of Health; U.S. Department of Health and Human Services web site 9-28-19, https://www.drugabuse.gov/
**************************
According to NIDA, marijuana concentrates can have, 50-80% THC, High potential for Addiction! https://www.drugabuse.gov/
**************************
It is our responsibility as parents, citizens and leaders to protect young people with sober-minded safe laws that prevent over-prescribing, prevent marketing harmful substances to young people, for example, five years ago, a medical doctor prescription was required for using marijuana mind altering substance. As states went recreational, marijuana use didn't just increase in communities, it increased at state levels. One states' substance use can affect a neighboring state. For example, when distributors were flooding West Virginia with opiates, it seeped to surrounding states, see state map for substance death rates by state.
-------------------------------------------------------------------------------------------------------------------------------------
The founder of Bryan's Hope, Jeannie Richards, indicated reporting was needed to understand the magnitude of the substance problem, to prevent the next generation of children from stepping into the horrible substance situation.
In this day teens and adults are confronted with a variety of critically addictive and poisonous substances while at the same time receive mixed messages from television, cable, internet, radio, songs and books about people using mind-altering sAubstances without noting any real harm, which is wrong and deceiving!
Source:
Centers for Disease Control and Prevention, National Center for Health Statistics. Dataset: Underlying Cause of Death. 1999-2017 on CDC WONDER Online Database, released December, 2018. Data from the Multiple Cause of Death Files, 1999-2017, as compiled from data provided by the 57 vital statistics jurisdictions through the Vital Statistics Cooperative Program. CDC source data, but not a CDC publication. Data Accessed at http://wonder.cdc.gov/
Substance ICD List
The substance ICD list for this report is listed below. ICD (International Statistical Classification of Diseases and Related Health Problems) 10th Revision, World Health Organization, 2010.
http://apps.who.int/classifications/icd10/browse/2010/en
Substance Death ICD List
ICD Description and Code
Alcohol: Mental and behavioural disorders due to use of alcohol, (ICD F10)
Opioids: Mental and behavioural disorders due to use of opioids, (ICD F11)
Cannabinoids: Mental and behavioural disorders due to use of cannabinoids, (ICD F12)
Sedatives Or Hypnotics: Mental/behavioural disorders due to use of sedatives or hypnotics, (ICD F13)
Cocaine: Mental and behavioural disorders due to use of cocaine, (ICD F14)
Stimulants: Mental and behavioural disorders due to use of other stimulants, (ICD F15)
Hallucinogens: Mental and behavioural disorders due to use of hallucinogens, (ICD F16)
Tobacco: Mental and behavioural disorders due to use of tobacco, (ICD F17)
Psychoactive: Mental & behavioural disorders due to multiple drug use & use of other psychoactive substances, (ICD F19)
Degeneration of nervous system due to alcohol, (ICD G31.2)
Alcoholic polyneuropathy, (ICD G62.1) Polyneuropathy due to other toxic agents, (ICD G62.2)
Alcoholic myopathy, (ICD G72.1)
Myopathy due to other toxic agents, (ICD G72.2)
Alcoholic cardiomyopathy, (ICD I42.6)
Cardiomyopathy due to drugs and other external agents, (ICD I42.7)
Respiratory conditions due to chemicals, gases, fumes and vapours (ICD J68)
Respiratory conditions due to unspecified external agent, (ICD J70.9)
Alcoholic gastritis, (ICD K29.2)
Alcoholic liver disease, (ICD K70)
Alcohol-induced acute pancreatitis, (ICD K85.2)
Alcohol-induced chronic pancreatitis, (ICD K86.0)
Newborn affected by maternal use of tobacco (ICD P04.2)
Newborn affected by maternal use of alcohol, (ICD P04.3)
Newborn affected by maternal use of drugs of addiction, (ICD P04.4)
Fetal alcohol syndrome (dysmorphic), (ICD Q86.0)
Finding of alcohol in blood, (ICD R78.0)
Contact with steam and hot vapours, (ICD X13)
Poisoning: nonopioid analgesics, antipyretics and antirheumatics (ICD X60 X40 Y10)
Poisoning: antiepileptic, sedative-hypnotic, antiparkinsonism & psychotropic drugs, not elsewhere classified (ICD X61 X41 Y11)
Poisoning: narcotics & psychodysleptics [hallucinogens], not elsewhere classified (ICD X62 X42 Y12)
Poisoning: other drugs acting on the autonomic nervous system (ICD X63 X43 Y13)
Poisoning: other and unspecified drugs, medicaments and biological substances (ICD X64 X44 Y14)
Poisoning: alcohol (ICD X65 X45 Y15)
Poisoning: organic solvents and halogenated hydrocarbons and their vapours (ICD X66 X46 Y16)
Poisoning: other gases and vapours (ICD X67 X47 Y17)
Poisoning: pesticides (ICD X68 X48 Y18)
Poisoning: other and unspecified chemicals and noxious substances (ICD X69 X49 Y19)
Assault by drugs, medicaments and biological substances, (ICD X85)
Assault by gases and vapours, (ICD X88)
Assault by steam, hot vapours and hot objects, (ICD X98)
Contact with steam, hot vapours and hot objects, undetermined intent, (ICD Y27)
Opioids and related analgesics, (ICD Y45.0)
Hydantoin derivatives, (ICD Y46.2)
Sedatives, hypnotics & antianxiety drugs [Barbiturates, Benzodiazepines, Cloral derivatives, etc.] (ICD Y47)
Anaesthetics and therapeutic gases (ICD Y48)
Psychotropic drugs, not elsewhere classified (ICD Y49)
Drug or medicament, unspecified, (ICD Y57.9)
Understanding death increase enables residents to locate critical populations to work on sober-minded solutions and give support. Living in Grace created these reports to improve the health and well-being of persons living in the United States. Recovery and sobriety works. Working together with governments, schools, places of worship, community groups, universities, colleges, hospitals, police, fire departments, EMS and businesses to help those suffering to recovery, support those in prison to prevent the next generation of children from stepping into the horrible substance situation.
Copyright information
Permission is given to print and share this report to support education and health of people, free of charge. When you share or print, suggested citation includes source, facebook page and blog.
Resources – Seeking Help
Medical Emergency Call 911
National Suicide Prevention Lifeline http://www.suicidepreventionlifeline.org
National Suicide Prevention Lifeline 1-800-273-8255
National Suicide Prevention Lifeline for Deaf; hard of hearing 1-800-799-4889
Intervene, help your child to recovery, signs of drug use https://drugfree.org/article/spotting-drug-use/
Treatment Locator – National listing by SAMHSA call 1-877-250-4665 (Mon-Fri 9-5 ET) or go to https://findtreatment.samhsa.gov/locator
Intervene, prepare to Take Action if You Suspect Teen or Young Adult Drug Use https://drugfree.org/article/prepare-to-take-action/
Signs of Opiod Use and getting Help (Understanding the Opioid Epidemic; What You Can Do) https://drugfree.org/article/get-help-for-a-loved-one/
How to Use Narcan/Naloxone https://drugfree.org/article/overdose-response-treatment/
6 Things to Do Before Your Child comes Home from Addiction Treatment https://drugfree.org/parent-blog/steps-to-take-before-son-or-daughter-returns-from-addiction-treatment/
24 Hour Toll Free Prayer Lines
Daystar 1-800-329-0029
Catholic prayer hotline TBD
National Prayer Center Assemblies of God 1-800-477-2937
Christian Broadcasting Network (700 Club) 1-800-759-0700
Common Ground: (248) 456-8144 to ask questions, go to treatment or detox (coming off a mind-altering substance is hard, it can temporarily make a person feel suicidal that is why protected recovery detox is important to have support during withdraw and to build recovery support). Some people have a hard time sleeping during early recovery, this is another reason for addiction treatment, so a person doesn't have to be responsible for work during withdraw. Some mind-altering substances require tapering off, medical support for safe detoxification withdraw to reduce risk of harm (e.g., seizures, hallucinations, etc.) these are alcohol, opiates, benzodiazepines, methamphetamine, oxycontin, methadone or suboxone).
Veteran’s and their Families. http://www.veteranscrisisline.net/Resources/SpreadTheWord.aspx
Veteran’s and their Families Call: 1-800-273-8255
Responsibility:
Young people are a blessing and are made to live. Losing young people to substances in the land in which we live is devastating, we must never forget those we lost and keep moving forward with a kind sober-minded heart to prevent the next generation from stumbling into this situation.
When young deaths rise, a critical situation is occurring, as responsible citizens, we find ways to support young people: tell the truth about the deceiving nature of mind-altering substances, help young people to recovery, support churches, recovery centers, prisons and support sober-minded laws and sobriety education in schools.
When young deaths rise, a critical situation is occurring, as responsible citizens, we find ways to support young people: tell the truth about the deceiving nature of mind-altering substances, help young people to recovery, support churches, recovery centers, prisons and support sober-minded laws and sobriety education in schools.
Greatest Commandment: Matthew 22:35-40
35 Then one of them, which was a lawyer, asked him a question, tempting him, and saying, 36 Master, which is the great commandment in the law? 37 Jesus said unto him, Thou shalt love the Lord thy God with all thy heart, and with all thy soul, and with all thy mind. 38 This is the first and great commandment. 39 And the second is like unto it, Thou shalt love thy neighbor as thyself. 40 On these two commandments hang all the law and the prophets.
Contact:
If you would like to join us in supporting good health of all people call 248-392-8676 or email hismatter@gmail.com or join us at
Understanding death increase enables residents to understand critical populations to work on solutions and give support. Living in Grace created these reports to improve the health and well-being of persons living in the United States.